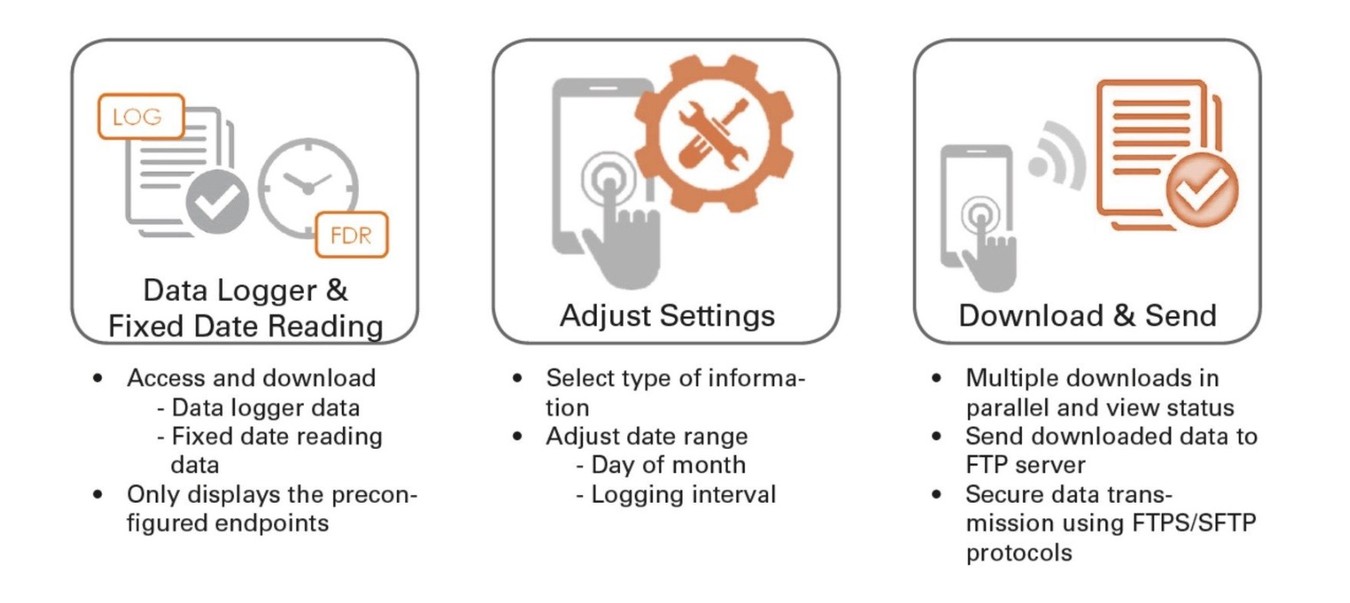
Data Logger App allows the collection of in-depth data from SensusRF water meters.
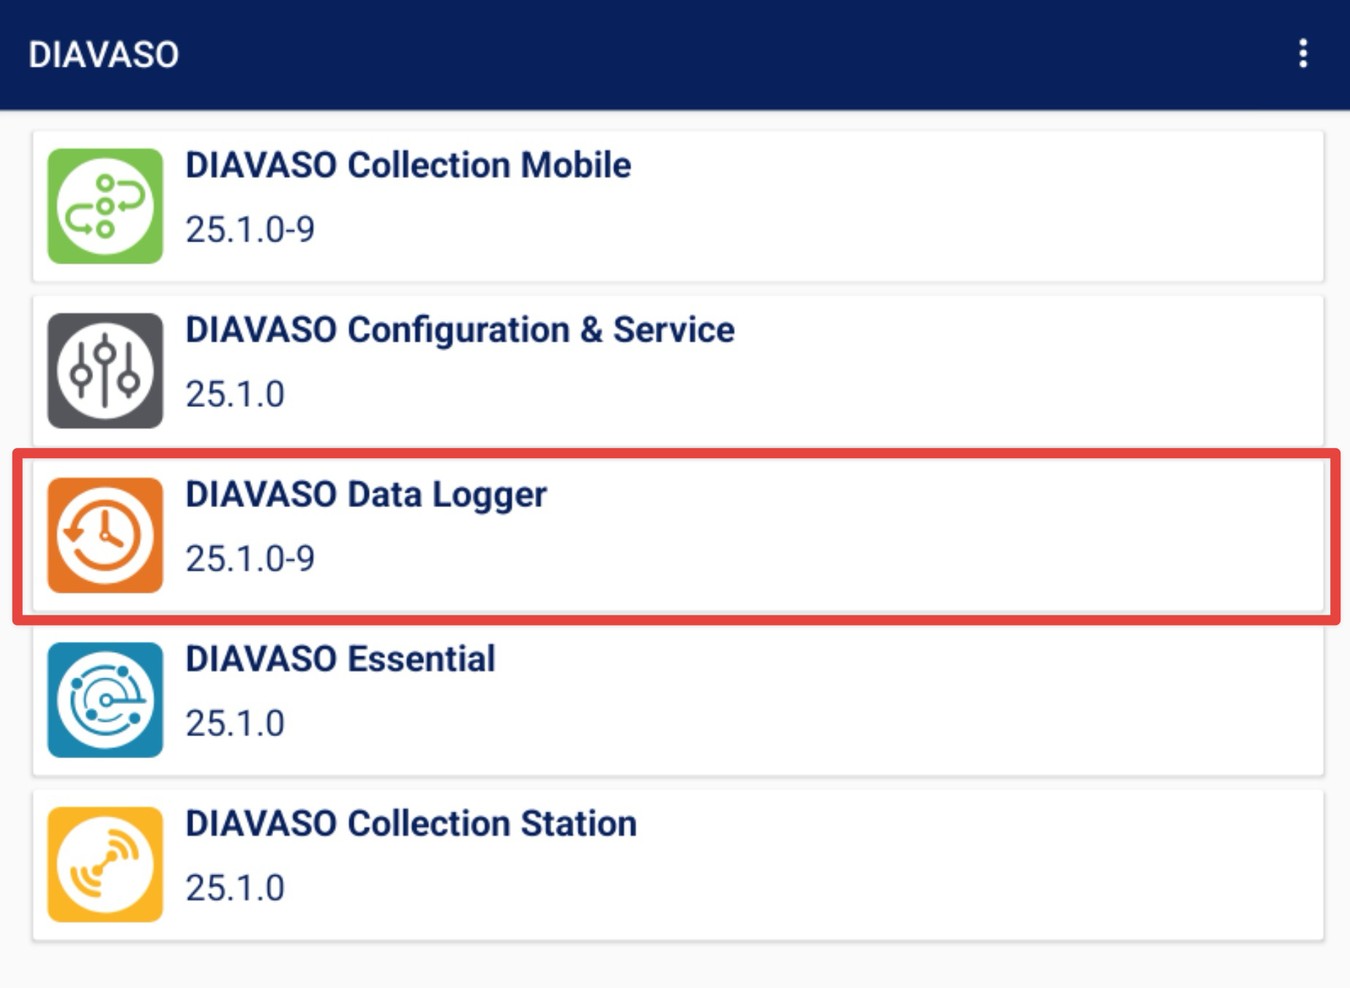
Step 1: Open the App
Start by launching the Diavaso Data Logger application on your device.
Please note that to download the data log files, you must be close enough to the meter to connect.
Step 2: Connect the SIRT
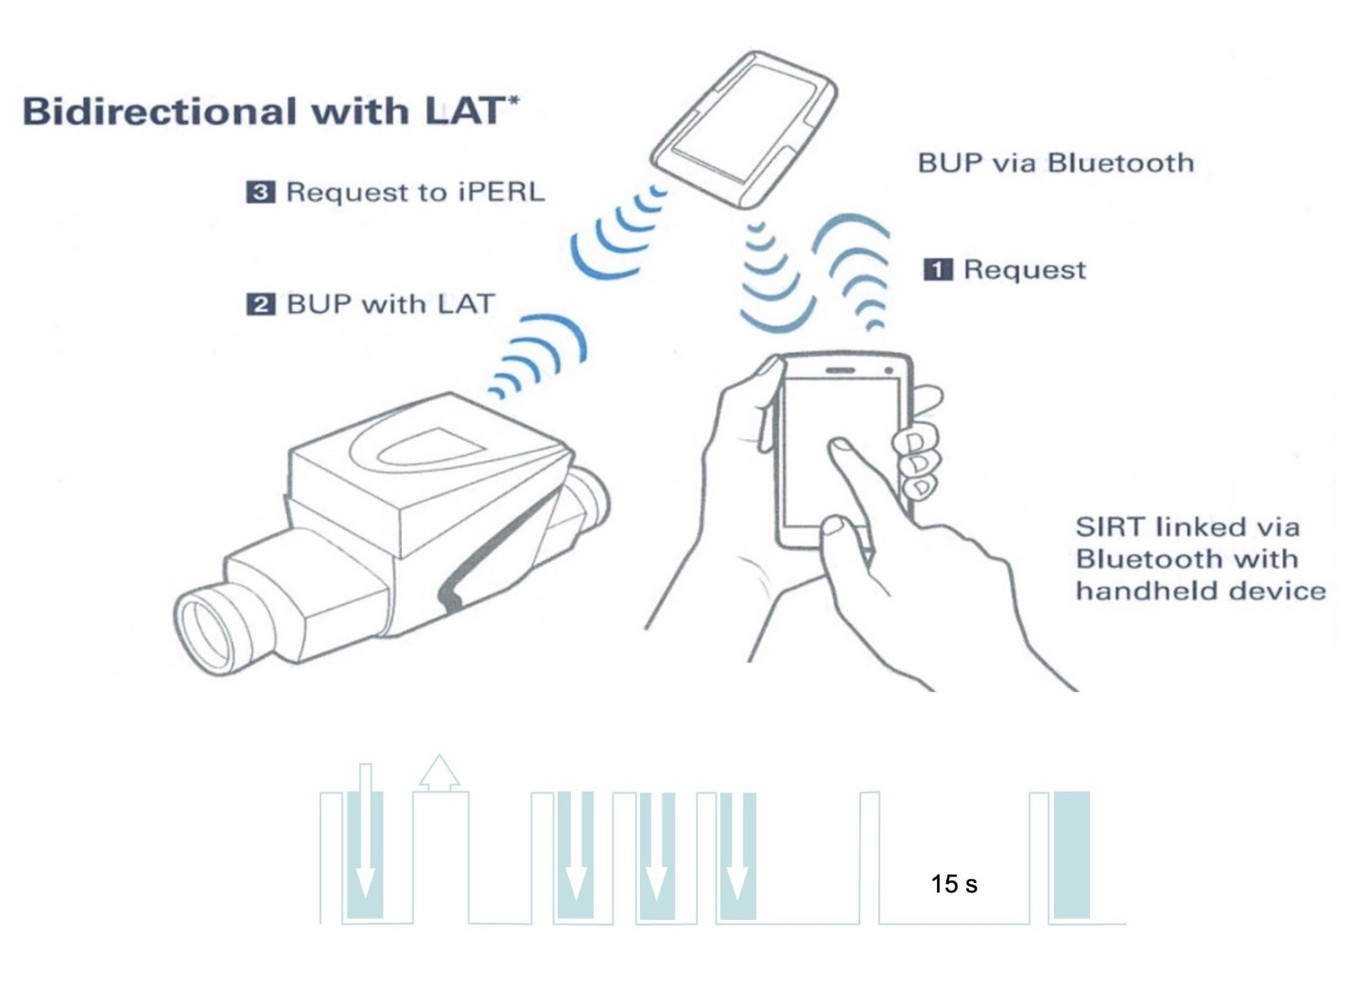
First, turn on your SIRT device:
To turn ON the SIRT - Press the bottom green button (2 sec).
The yellow LED will switch ON.
To TURN OFF SIRT - Press the bottom green button (2 sec).
The LED will switch OFF.

In the app, open the menu (the three-line button)
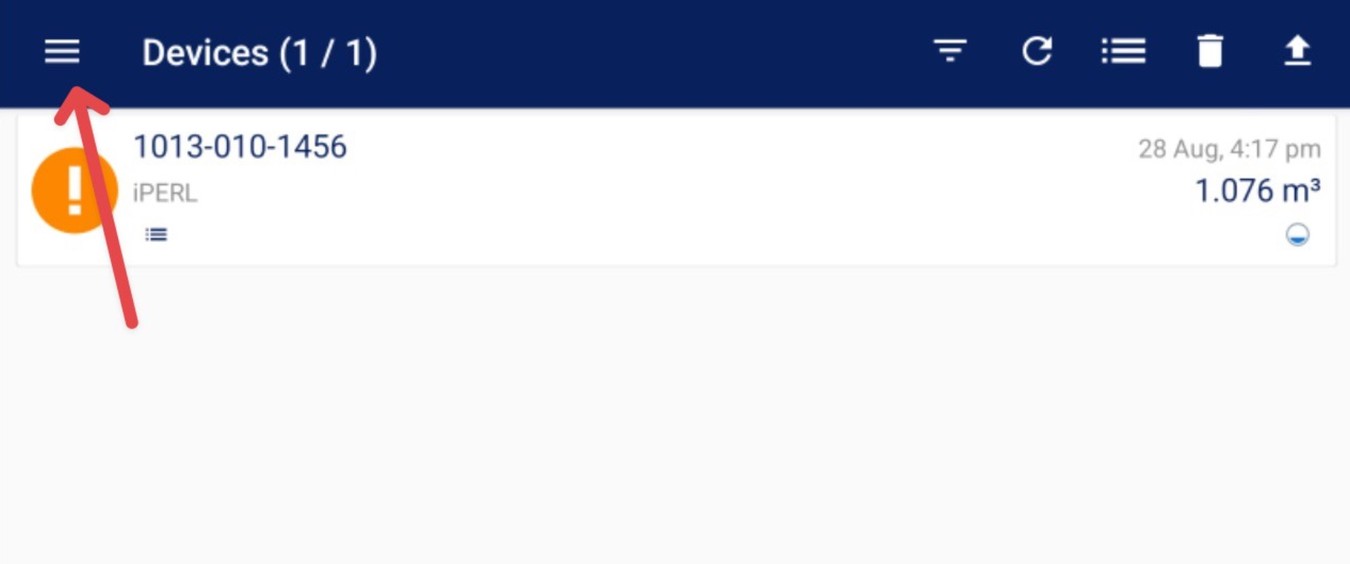
If you are using only one SIRT - you can click on the SIRT NOT CONNECTED button in the menu.


If you are using multiple SIRTS - You need to select the correct one.
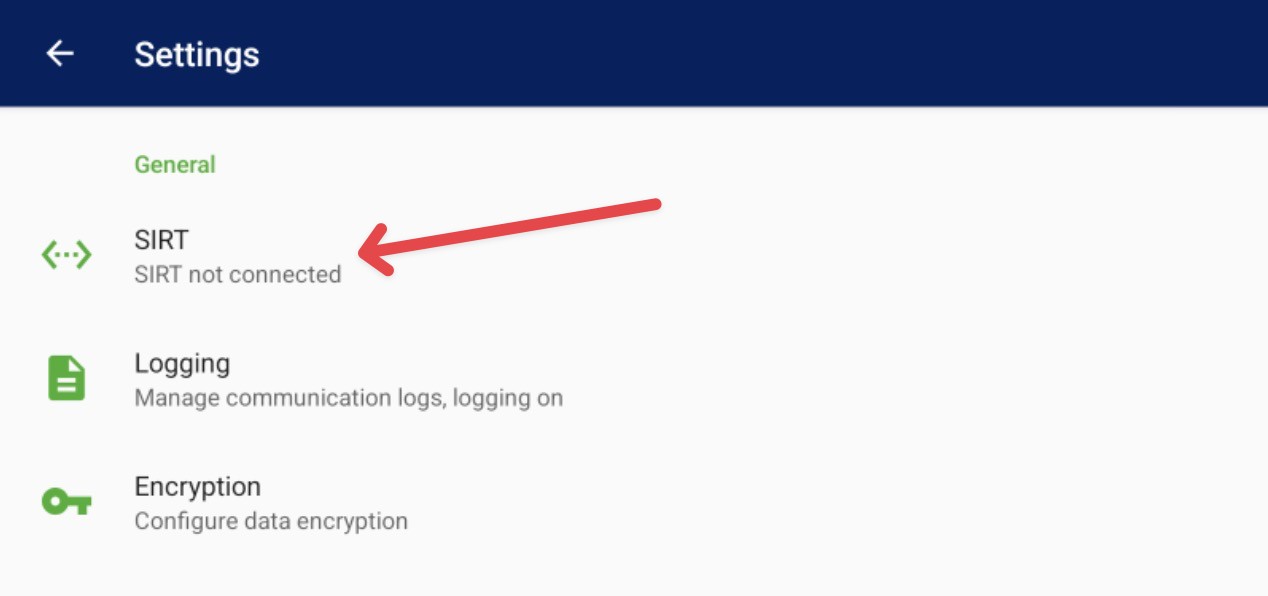
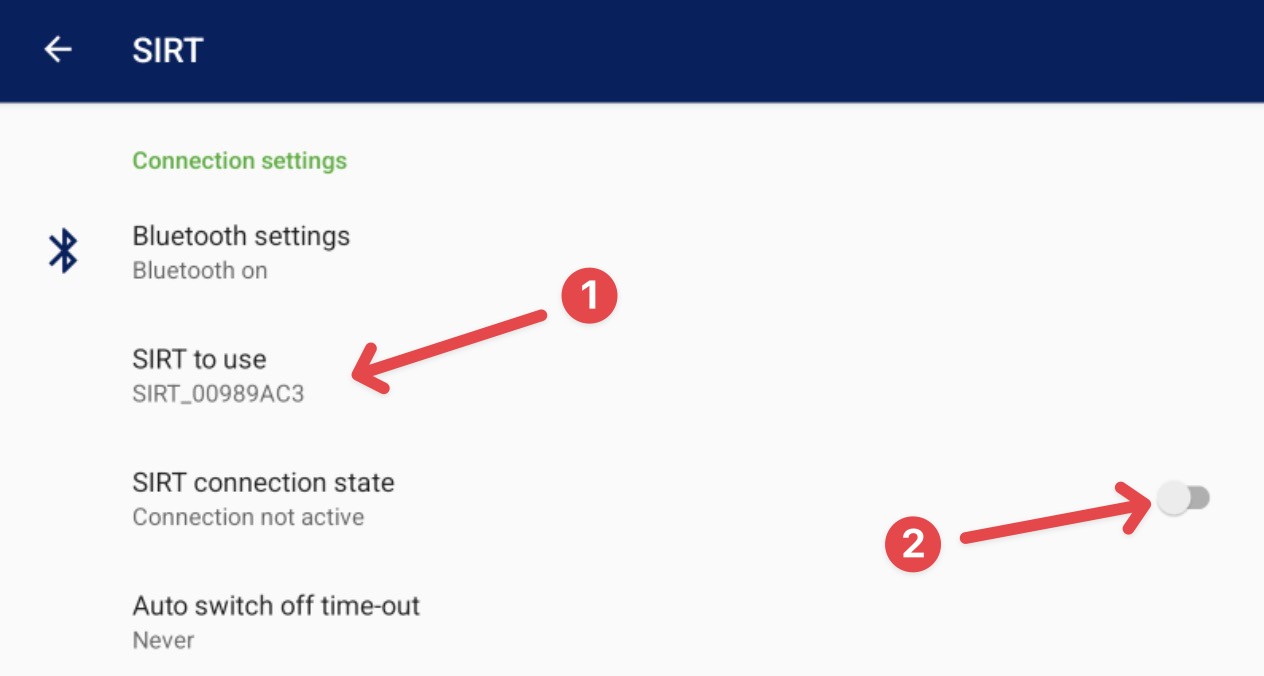
Go to Settings, and under the General tab, find the SIRT option. Select your SIRT from the dropdown once it’s turned on.
Toggle the connection state to connect the SIRT. Once connected, the Bluetooth light on the SIRT will turn blue.

Step 3: Add the Meter
Go back to the main screen. Tap the plus button to add a meter.
You can enter the meter address manually, scan its barcode, or select a nearby device.
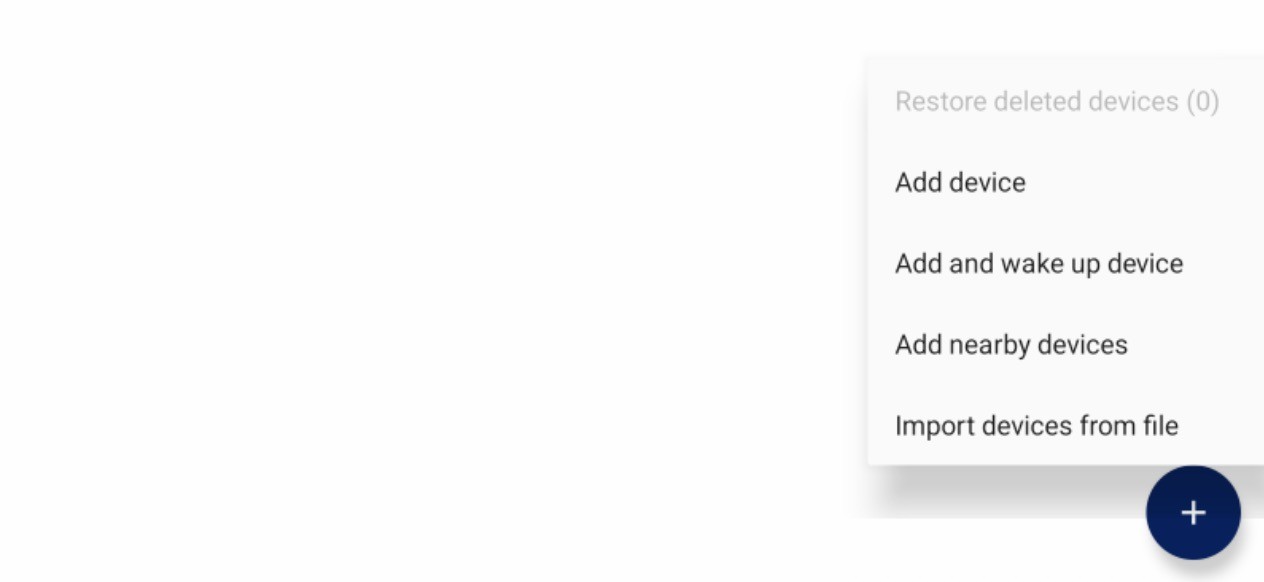
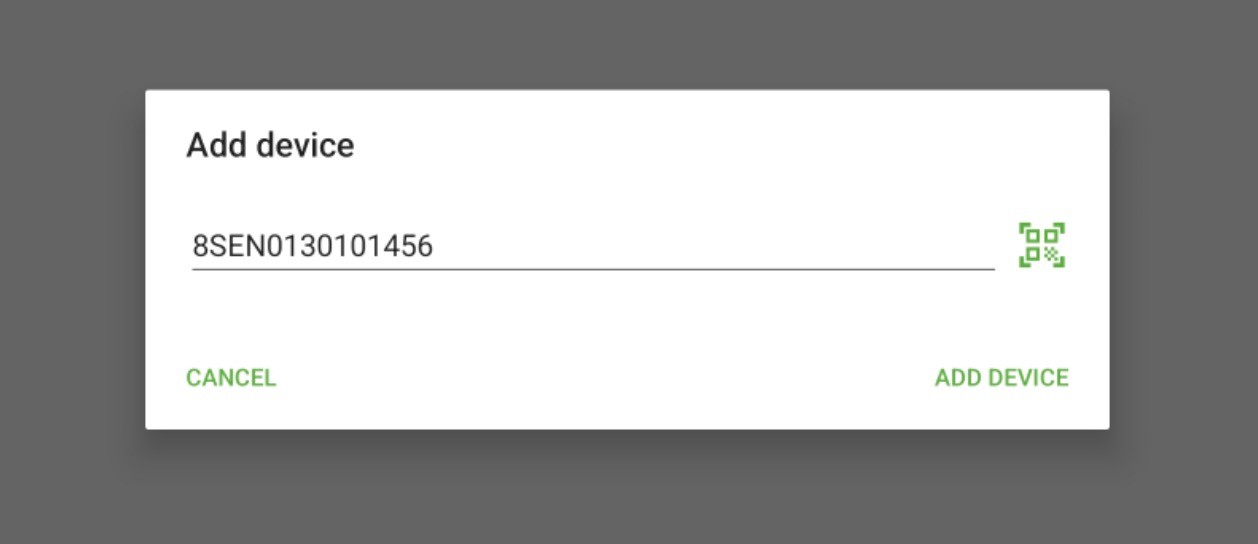
Important note: If the meter is newly delivered or has not yet been installed, the radio must be activated first. To activate, select Add and wake up device in the Config App or Data Logger App.
SensusRF meters can be activated in two ways:
- When the meter has been installed and at least 15 L of water has passed through.
- By using the Config App and selecting Add and wake up device.
Once added, the meter will appear in your list.

Step 4: Connect to the Meter
Tap on the meter in your list to connect. It may take around 45 seconds (depending on your distance from the meter). After connecting, you'll see its configuration details.
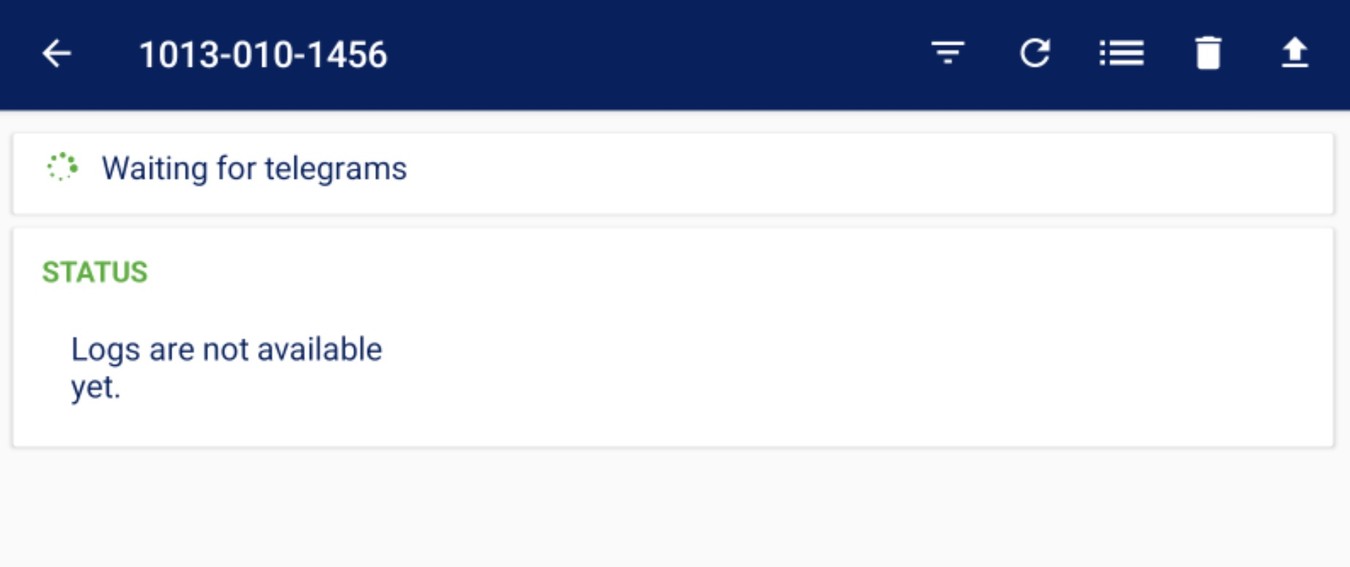
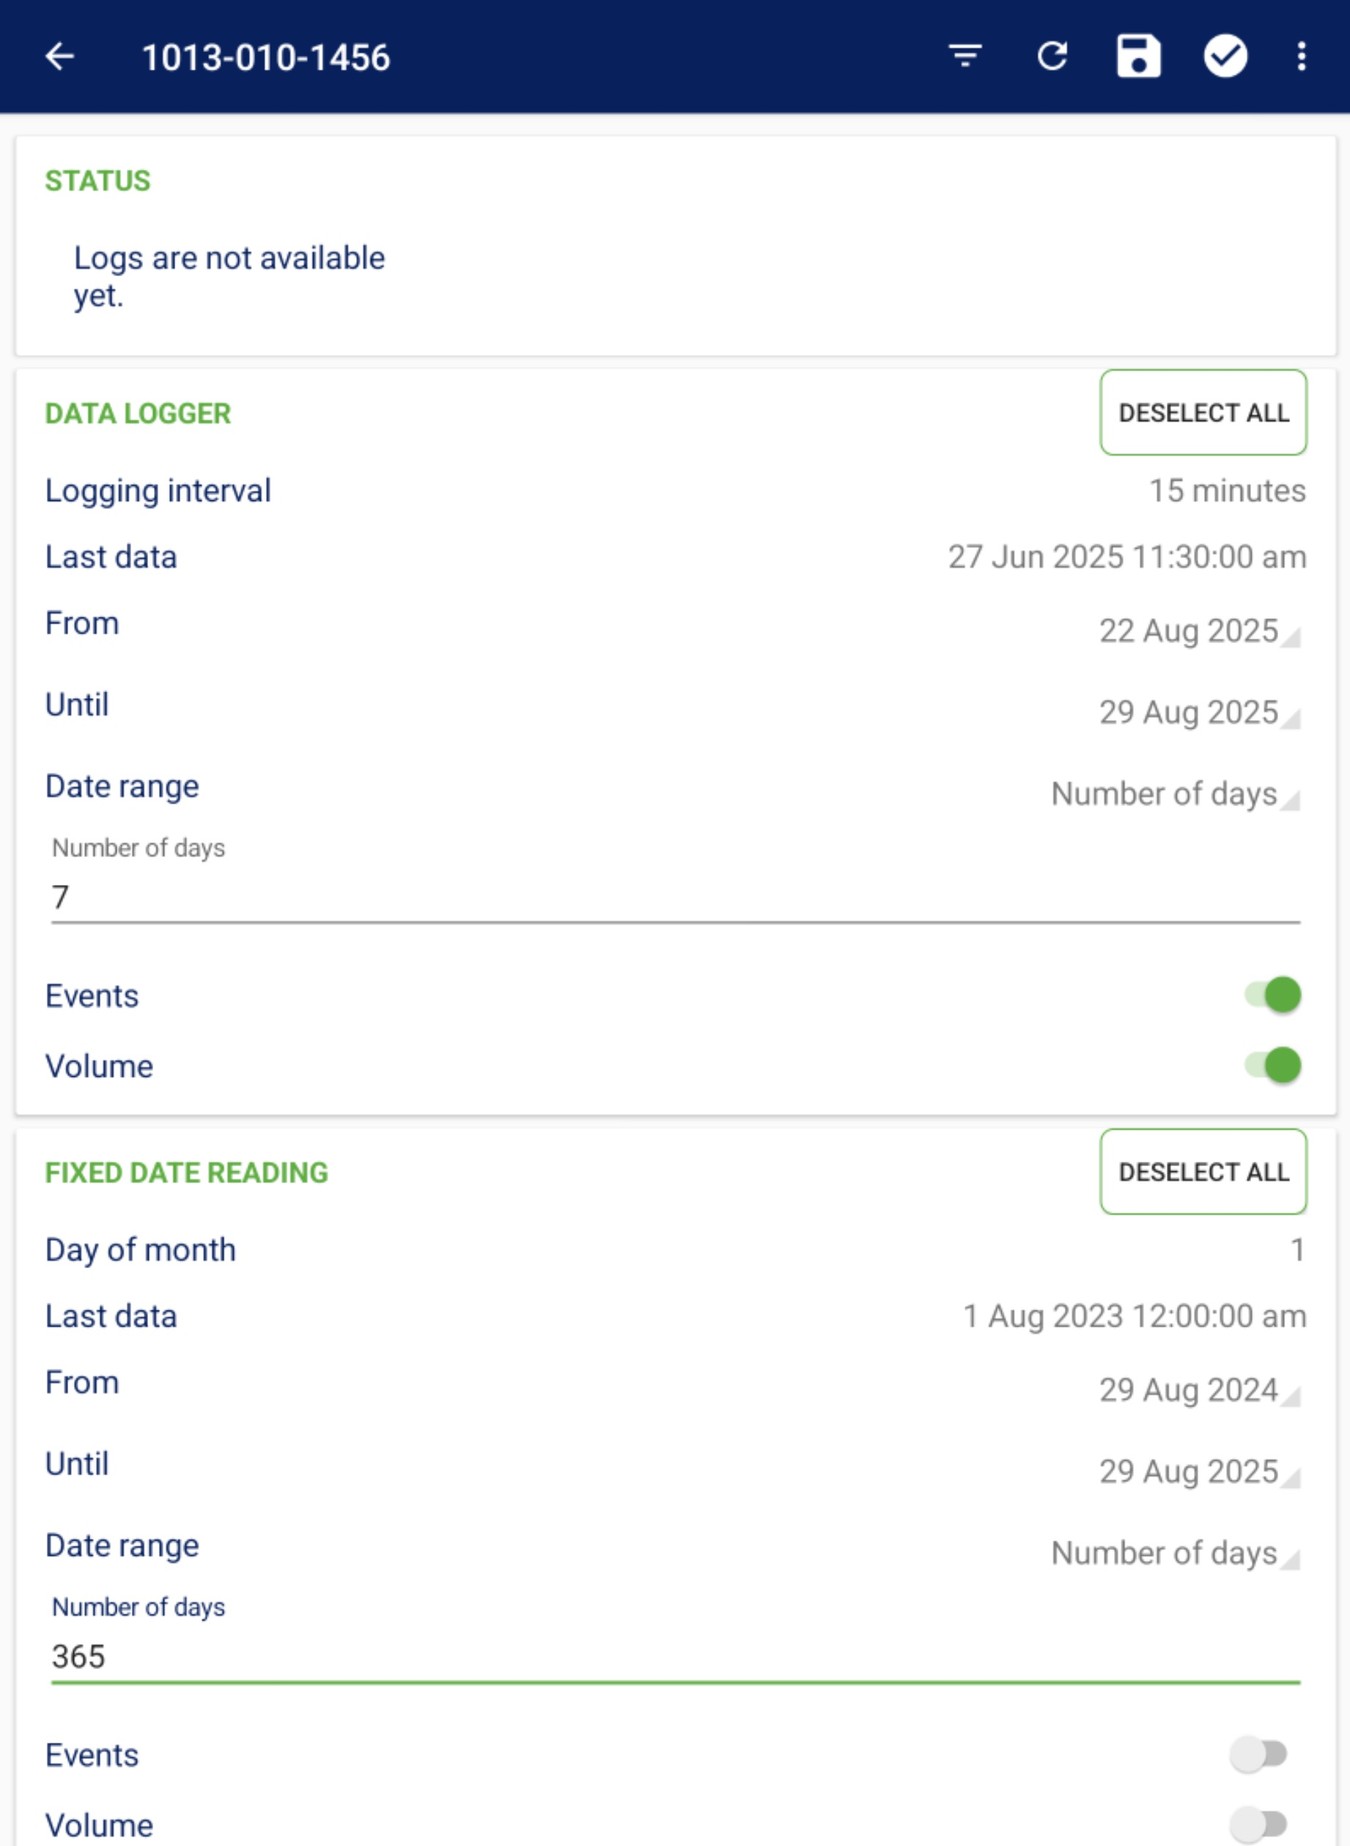
IMPORTANT:There are two types of Log Files
The Log screen is divided into two sections, the Data logger view and the Fixed date reading view. Information about the current log-related status of the meter and log controls display in both sections.
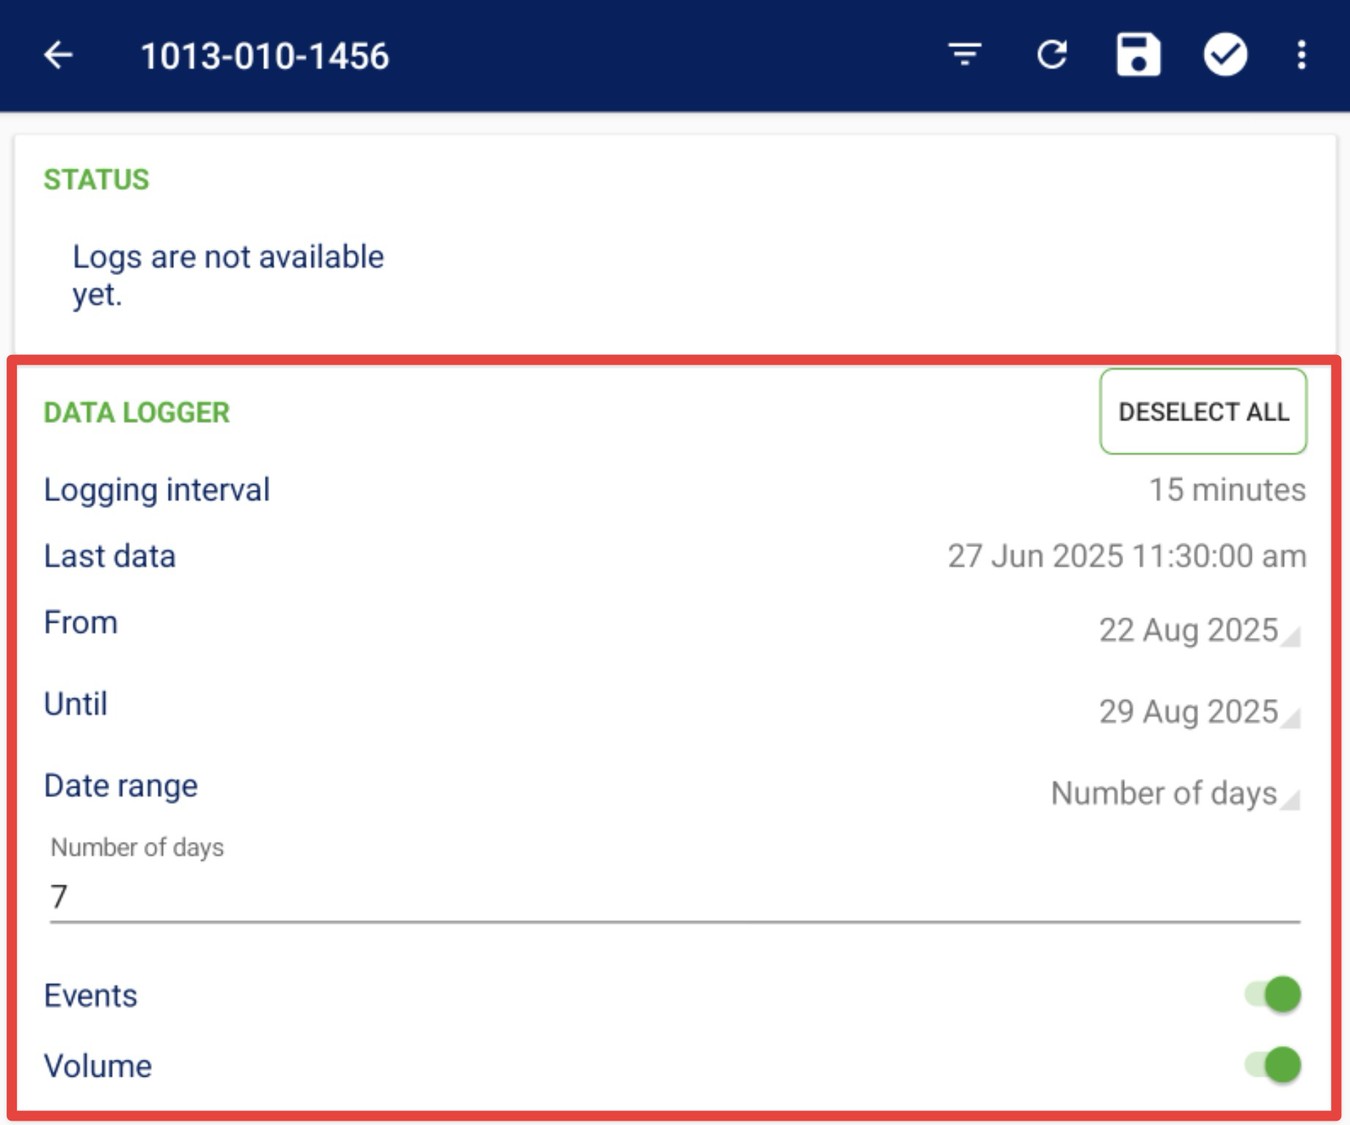
The Data logger view displays the current Logging interval and the Last data time. The last data is the date of the oldest reading in the device’s memory.
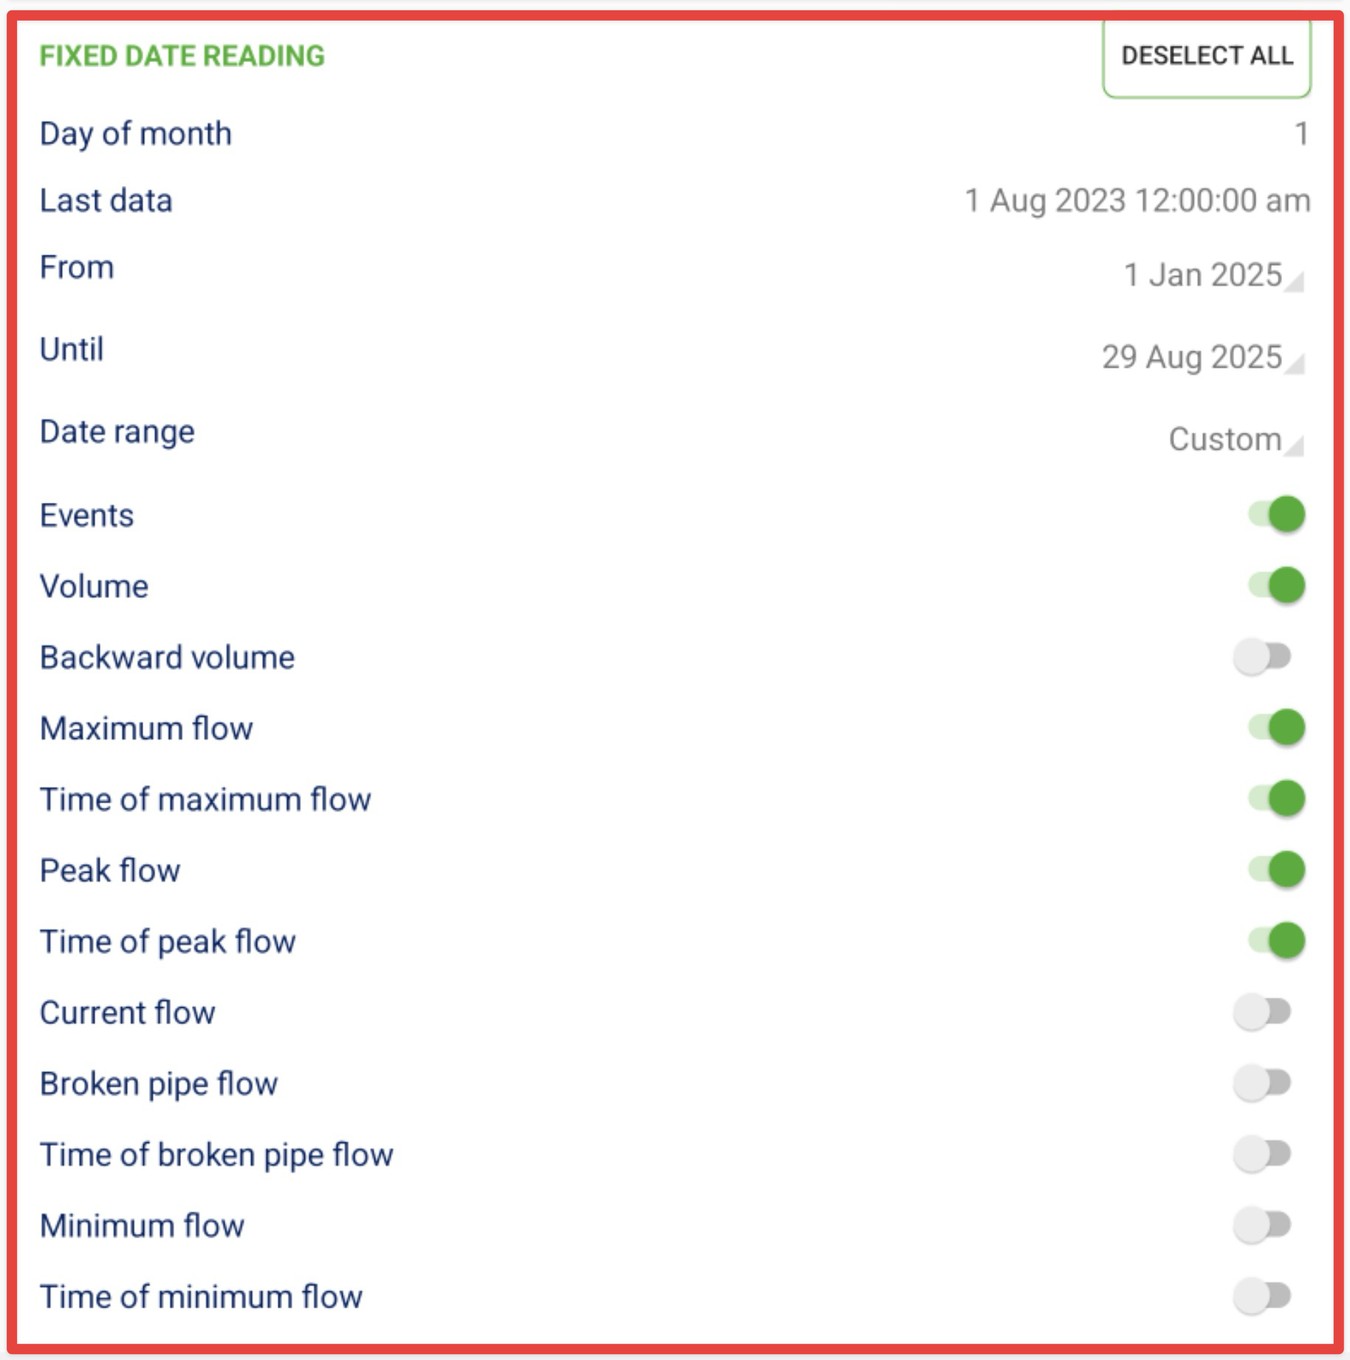
The Fixed date reading view displays the current Day of month and Last data time.
In both sections, you may set the time interval log data will be downloaded using the From and Until date pickers. Initially, From date is set based on the actual Logging Interval and Until date is set to the current date.
- If the Logging interval is less than 10 minutes, the From date is set back to 1 day from now.
- If the Logging interval is less than 1 hour, From date is set back to 7 days from now.
- Otherwise From date is set back to 1 month from now
All log counters configured for the selected meter display. Events State and Counter for Data Logger are enabled by default. All Fixed Date Reading counters are disabled by default.
In order to capture additional information (for example time of Maximum Flow) - the meter must be configured first.
Please refer to - How to: Change a SensusRF Meter Configuration Using Diavaso Configuration & Service App
Step 5: Select your Data Logger or Fix Date Reading time range
For example, if you want to download both the Data Logger at 15-minute intervals (assuming the meter has been configured for 15-minute logging) and the Fixed Date Readings for the past 6 months, simply check or uncheck the options you wish to include.
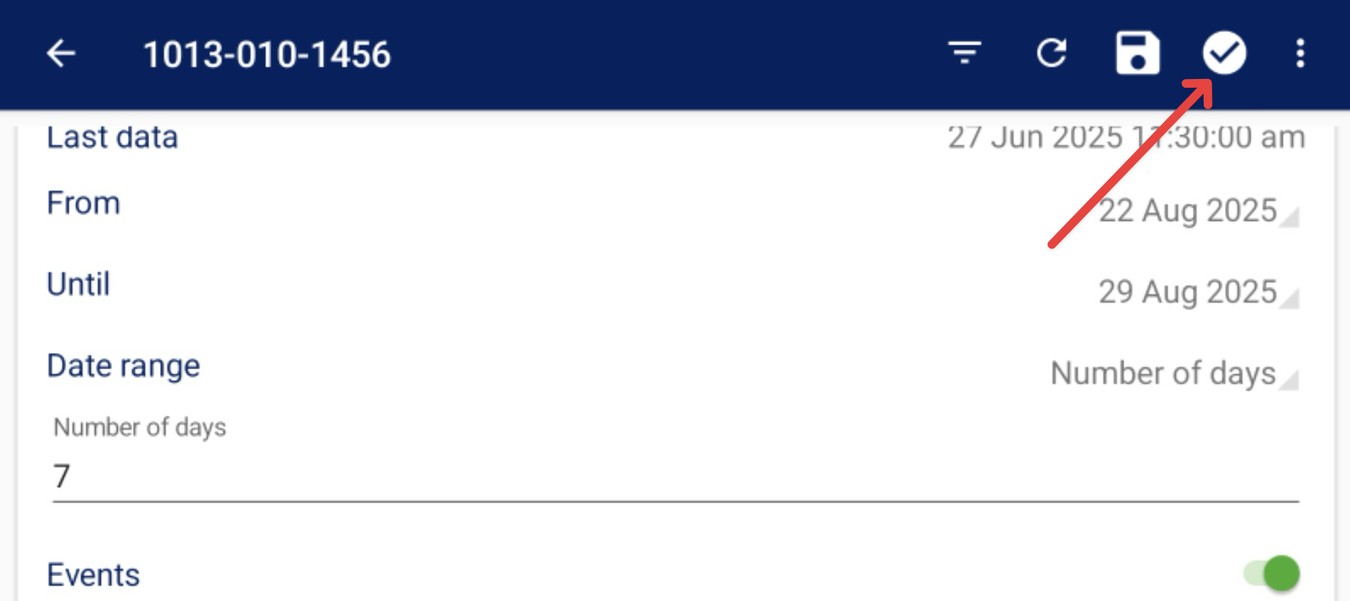
In the example below, I have selected:
- Data Logger at 15-minute intervals
- Date range from 22 August 2025 to 29 August 2025 (7 days total)
- Events / Alarms and Volume
And for the Fixed Date Reading, I have selected:
- Date range from 1 January 2025 to 29 August 2025
- Events, Volume, Maximum Flow, Time of Maximum Flow, Peak Flow, and Time of Peak Flow
After the selection - click on the Check mark icon to download the data.
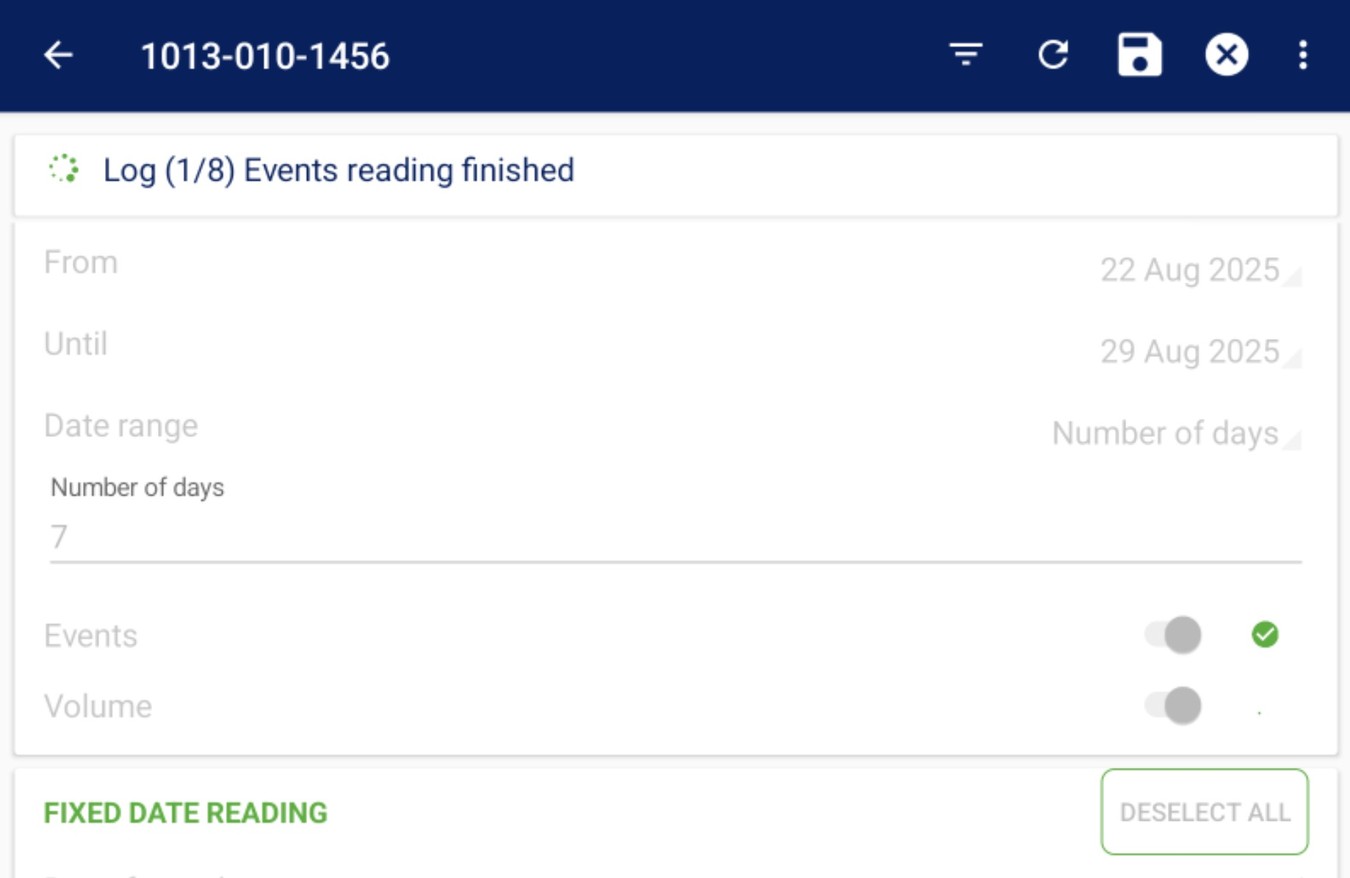
Data download in progress
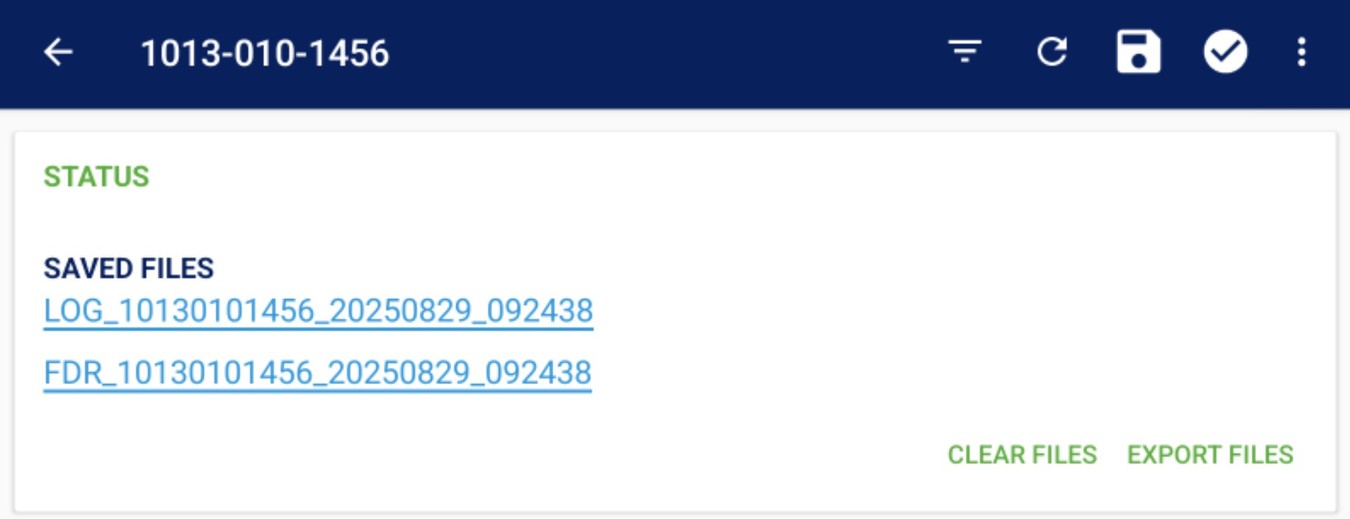
After the download, the files will be stored on the tablet as two separate files:
- LOG_ for the Data Logger file
- FDR_ for the Fixed Date Reading file
By clicking on a file name, you can preview it directly on your tablet.
The preview can be displayed in either List view or Graph view.
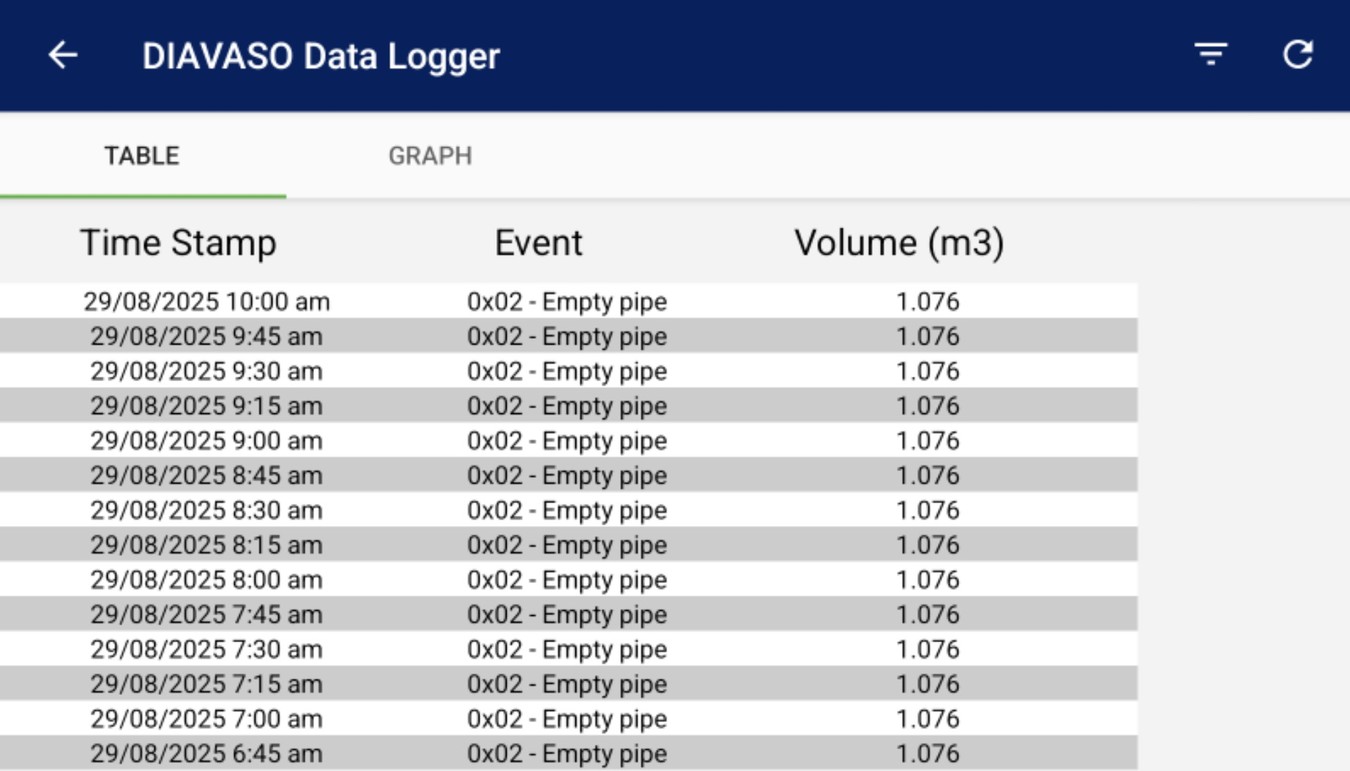
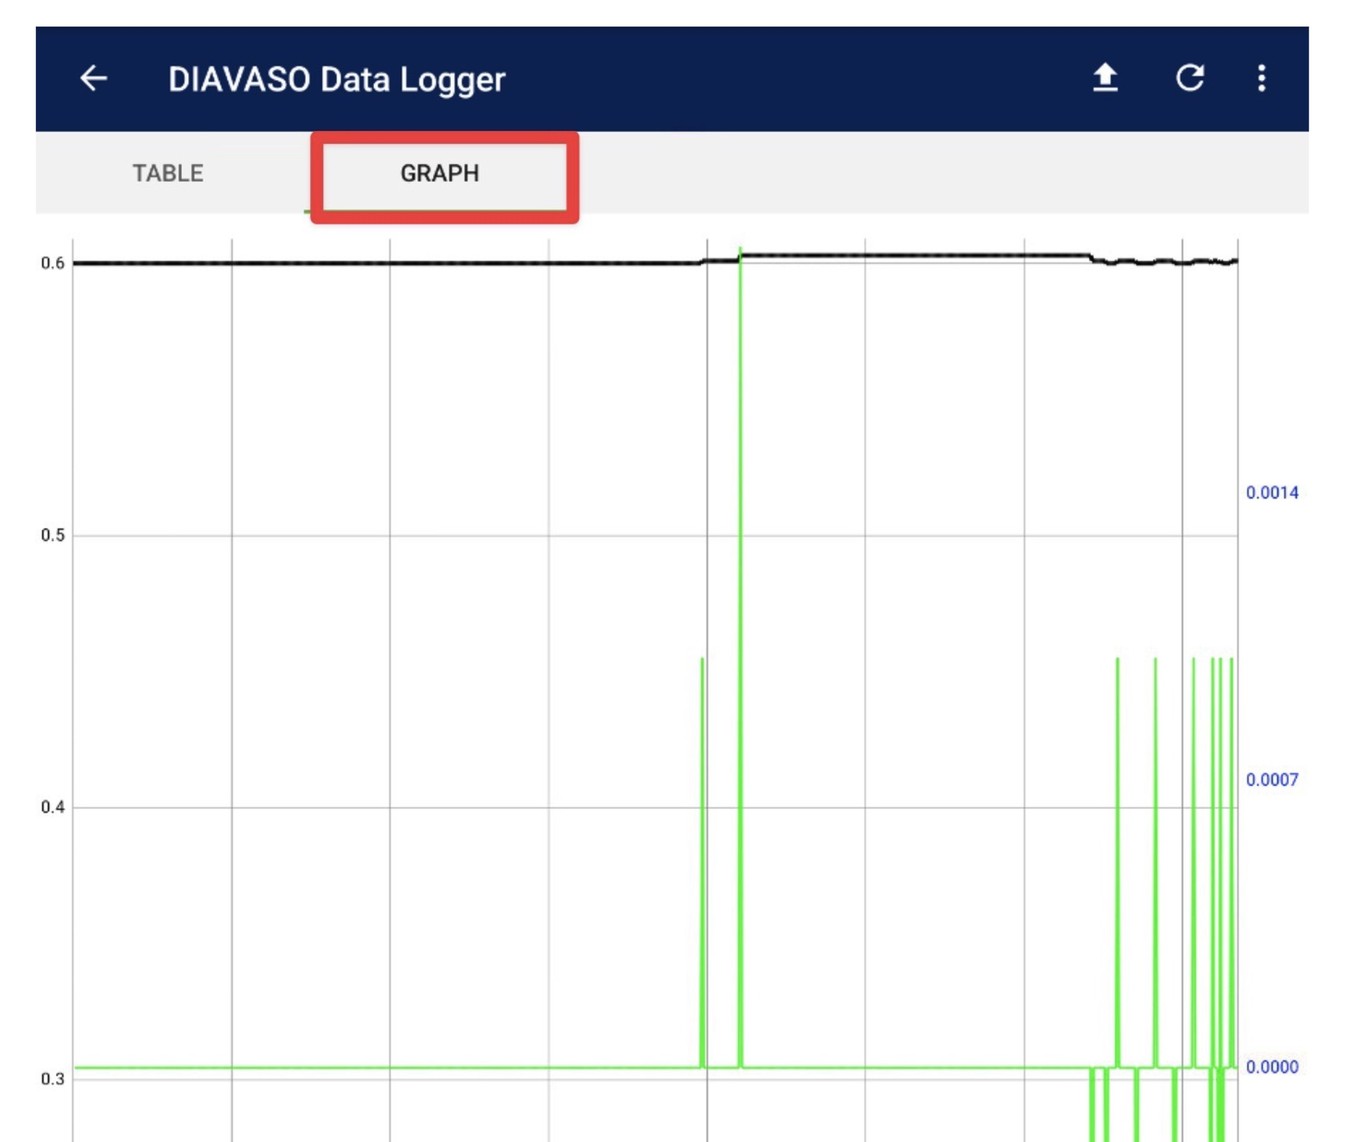
Pro Tip - Turn your tablet side ways to see the full graph
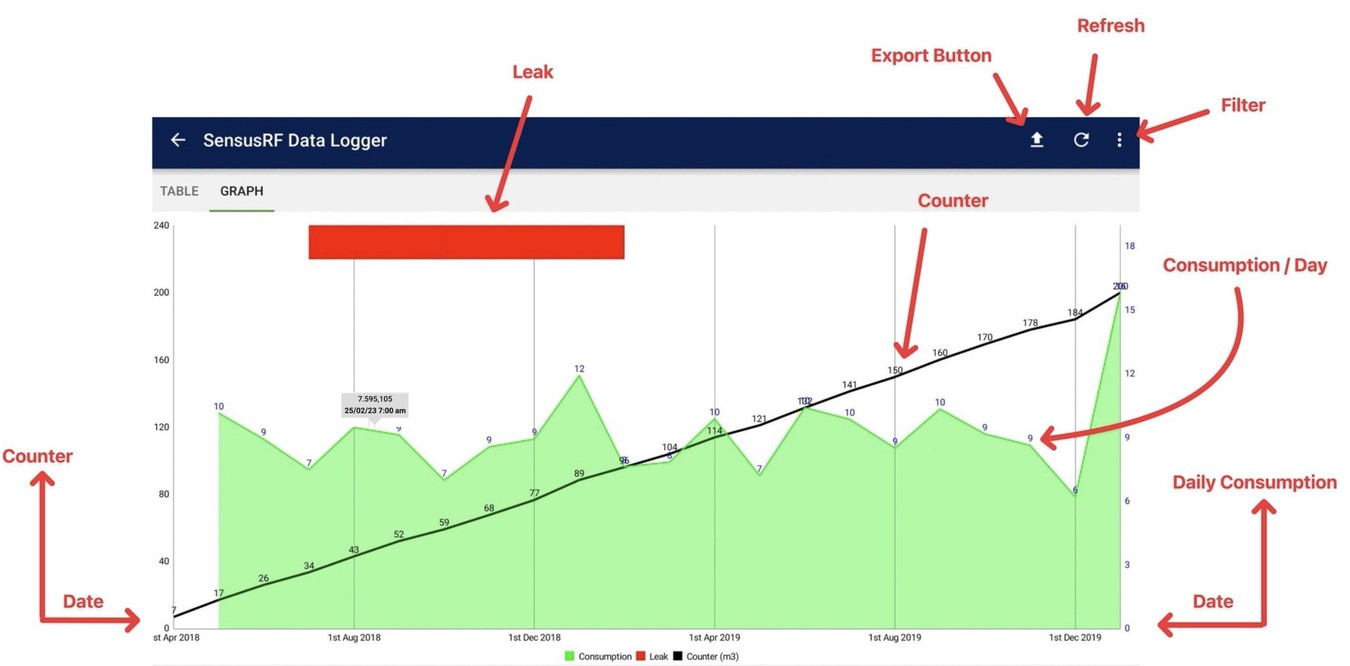
The data can be also exported into a CSV File


Data Logger - List of fields

- Time Stamp – Reading collection time
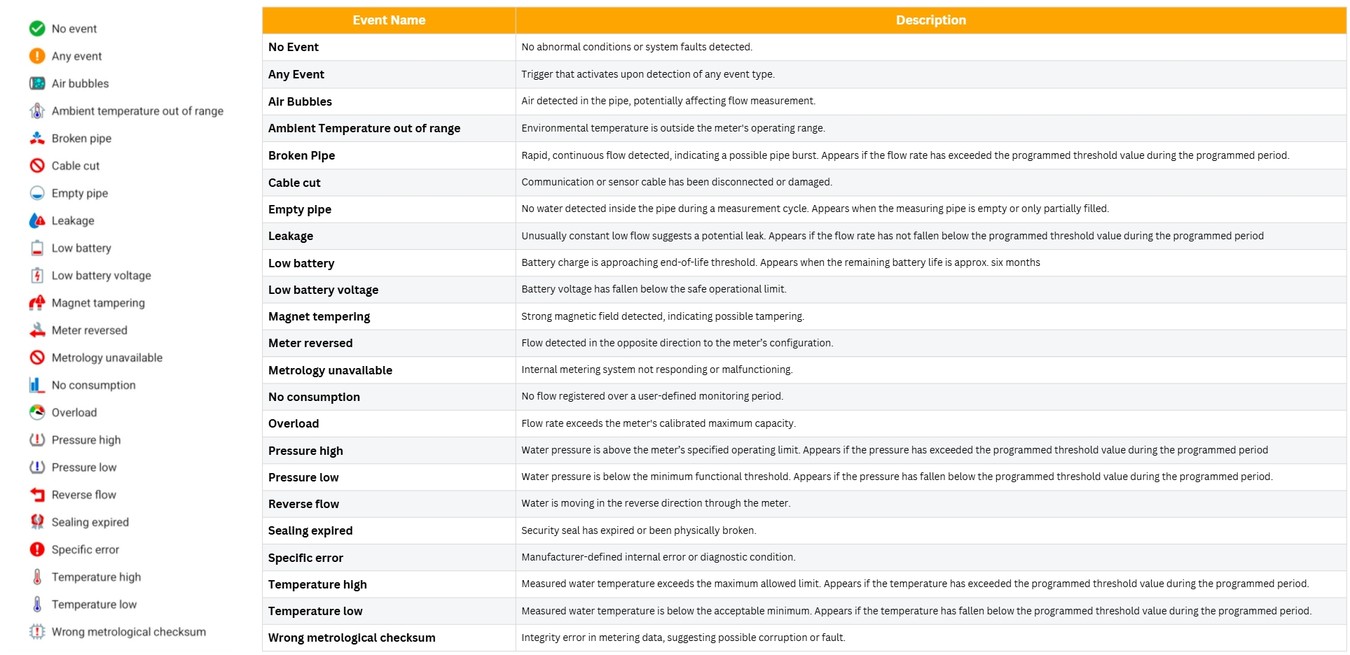
- Event – Possible alarm (see list below)
- Reading – meter usage
- Backward Volume – Logged reverse flow (if any)
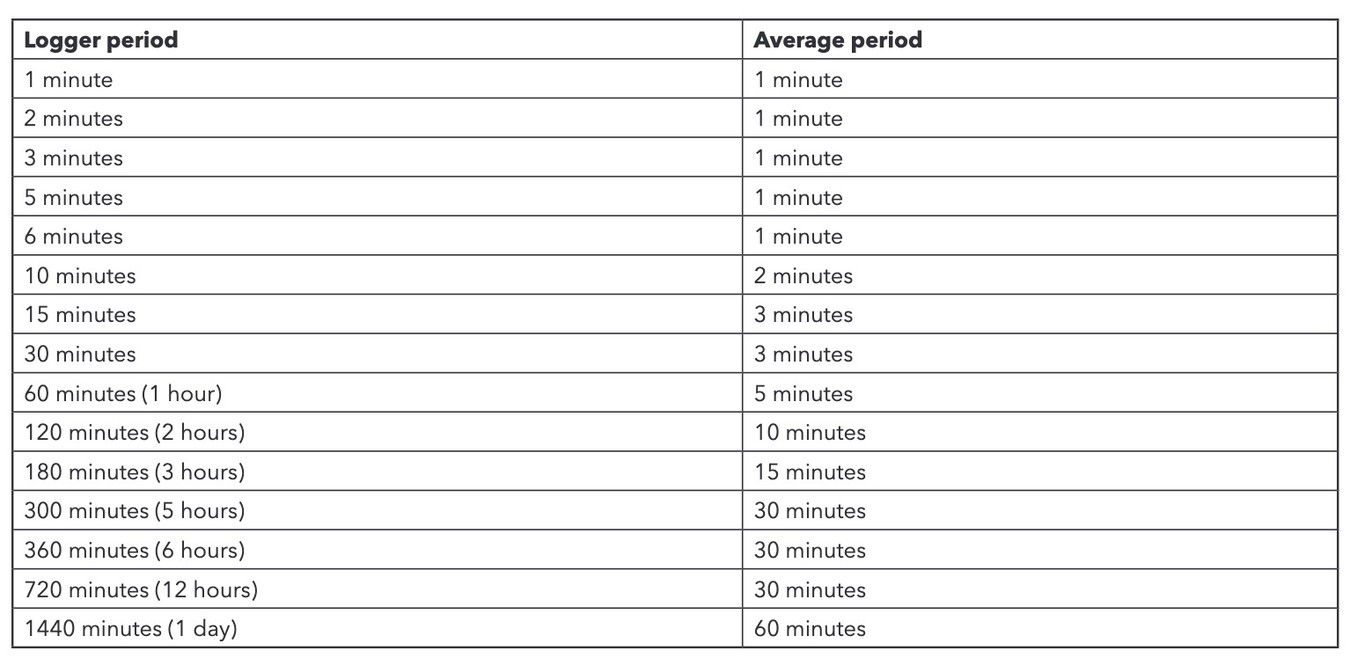
- Maximum Flow ** – Is the maximum average over a fixed period during the log internal, that period varies depending on the log interval set, assuming the factory default 15 min log intervals then the averaged period is 3 mins, Ie 5 samples taken over the 15 min log interval and averaged.
- Time of Maximum Flow – Time when Maximum flow was reached
- Peak Flow – The peak flow rate is defined as the maximum average flow rate value calculated by the instantaneous flow rates in a 2s interval. When a peak flow rate occurs, that value is registered along with its date and time of occurrence. If a new value is calculated above the registered QPEAK, the new value will become the QPEAK along with its date and time of occurrence. This value is reset to zero when an FDR occurs if this variable is selected for FDR registration. It is also possible to reset it by a specific reset communication command.
- Time of Peak Flow – Time when Peak Flow was reached
- Current Flow – Flow at the given time, based on user demand
- Broken Pipe Flow – Flow exceeding triggers a “Broken Pipe” alarm
- Time of Broken Pipe – Time when the broken pipe condition was detected
- Minimum Flow – Lowest recorded flow
- Time of Minimum Flow – Time when minimum flow occurred
- Forward Counter – Register’s forward flow counter
**Maximum flow rate - Calculation Table
List & Description of possible Alarms
Other related manuals:
How to: Download & Upload Data Log File from SensusRF Meter to CM Server
How to: Change a SensusRF Meter Configuration Using Diavaso Configuration & Service App


