Data Reports
The Data reports perspective can be reached from the Main menu or the Pull down menu by selecting Analyze/ Data reports.
The Data reports perspective is the place where the user may define formatted documents by which various reports may be generated.
There can be various types of reports: Consumption reports, Raw data reports or Event log reports.

Consumption reports
Refer to a selected group of valves, to a selected group of water meters, to certain crops, or to certain plots. These reports will supply data about the consumption of the selected items.
Irrigation Log
Contains a historical data of any past Irrigation Program. Including Start/Stop reasons, Cycle details & total volume summaries.
Raw data reports
Refer to an arbitrary combination of items picked from the target’s image and will supply information about their statuses.
Event log reports
Contain a list of events taken from the memorized Event log and optionally filtered by Severity, by Facility, and/or by belonging object.
The defined reports are just skeletons that do not contain any data until really generated.
Users will be able to generate reports on manual demand or reports can be scheduled to be generated automatically in a predefined cycle.
The generated reports can be set to be delivered as E-mails to the listed recipients in Excel worksheet format (csv).

Creating new Report
To create new Report - Click on the 'Add New' button.
The wizard is divided into 6 steps that lead the user through the definition process.
- Name
- Type
- Target / Controller
- Parameters
- Schedule
- Delivery

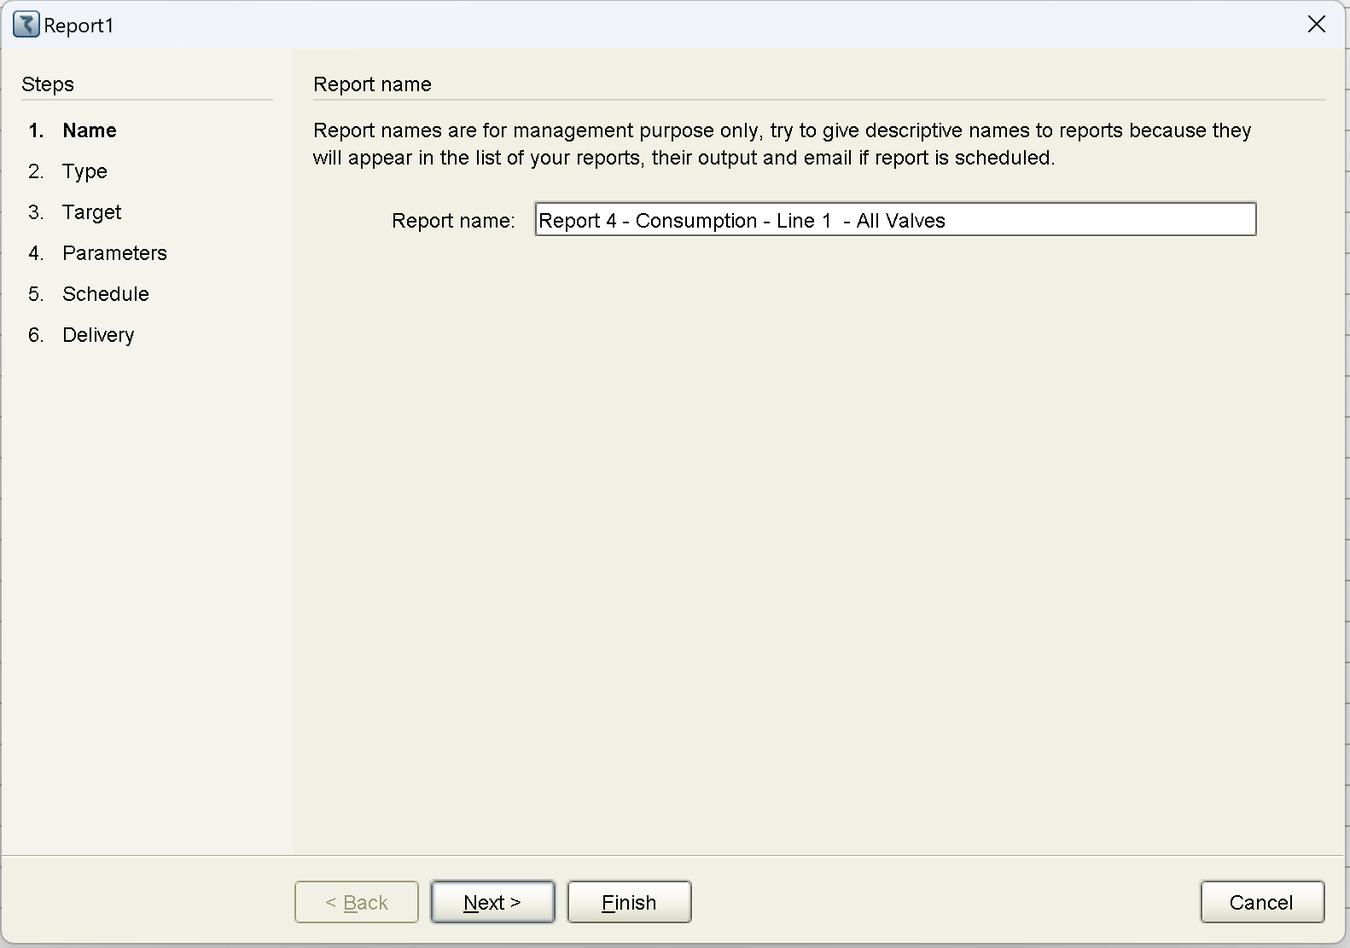
Step 1 - Report Name
Reports names are for management purposes only, try to give descriptive names to reports - as they will appear in the list of your reports, their output and email if report is scheduled.

Step 2 - Report Type
The second step deals with selecting the type of report you want to create.
- Consumption Report
- Raw Data Report
- Irrigation Log Report
- Event Log Report

Step 3 - Target/Controller
Reports are always based on data from specific controller. Select your controller from the list.
Changing the value may affect the rest of report parameters.

Step 4 - Parameters
This step covers the selection of items that will be included in the report.
This screen changes - depending on the report type.
Consumption Report
In case of consumption report, the items for selection will be:
- Valve
- Valves Group
- Water Meters
- Crops
- Plots

To complete the definition of the report we need to add some more information about its contents, the Rate at which the data will be sliced, whether or not to include per area calculations, NPK and totals per each time slice.
The Option for the Rate are as follows:
- Hourly
- Daily
- Weekly
- Monthly
- Yearly

Note: To select multiple Valves at once - Press and hold the SHIFT key


Example of a Consumption Report - Water Meters
Monthly Report (July - September 2024)

Example of a Consumption Report - Valves
Monthly Report (July - September 2024)
Irrigation Log Report
The Irrigation Log Report contains information about the past Irrigation program runs.


Example of a Irrigation Log Report
From 01/11/2024 - 05/11/2024 for program called 'P2 (2. Entire Orchard - Night Two)
Raw Data & Event Log Reports
In case of Raw Data reports there will be a tree of items presented for selection.

When defining Event log reports - the user is given multiple filtering tools to be able to pick the particular events he is interested in.

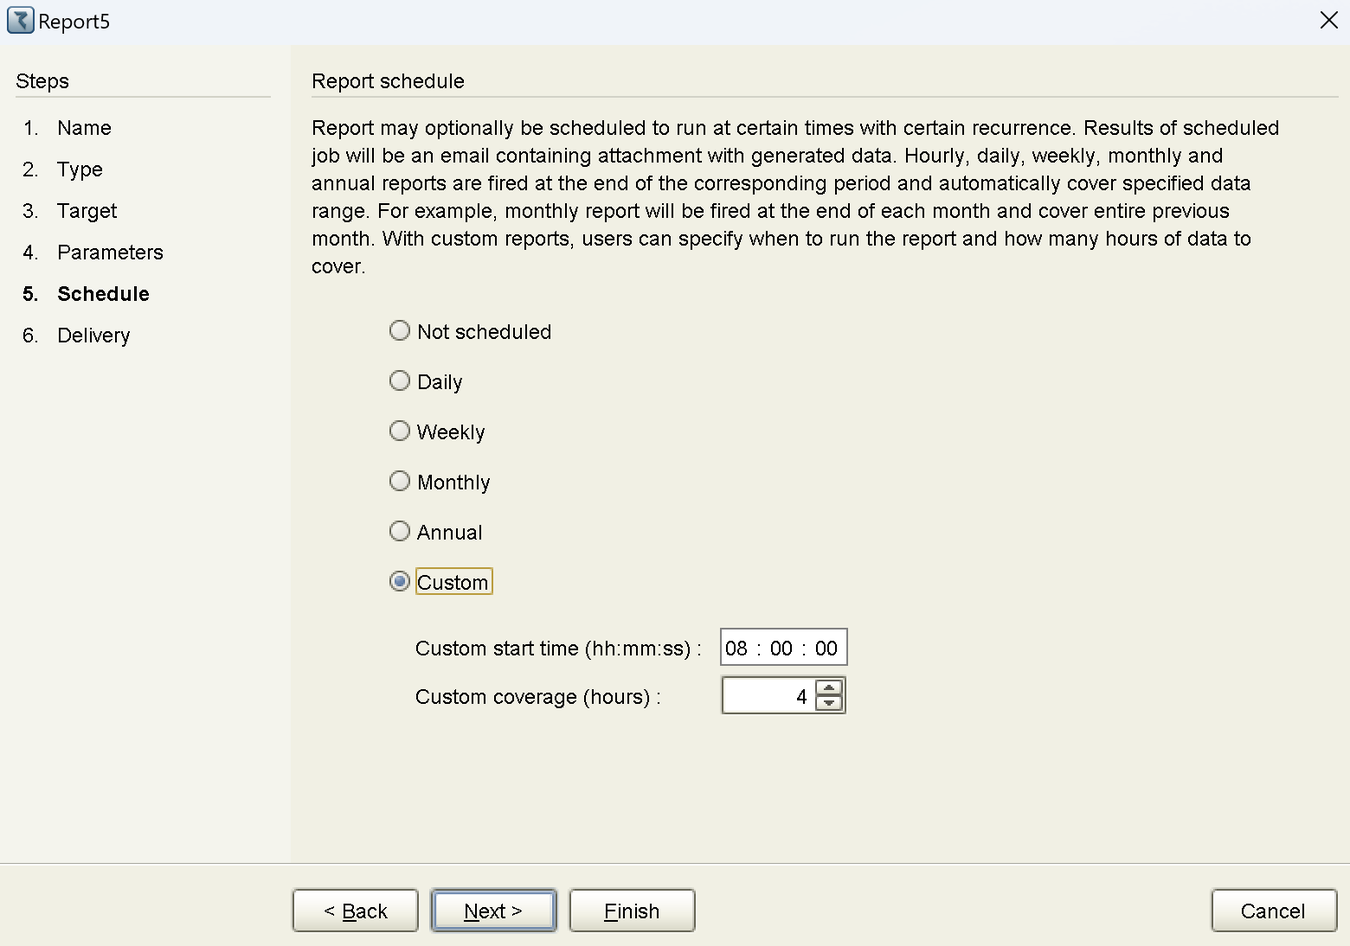
Step 5 - Schedule
Report may visually be scheduled to run at certain times with certain recurrence.
The results of scheduled job will be sent via email containing attachment with the generated data.
Hourly, daily, weekly, monthly and annual reports are sent at the end of the corresponding period and automatically cover specific data range.
For example: Monthly reports will be sent at the end of each month and cover entire previous month.
With custom reports, users can specify when to run the report and how many hours of data to cover.
Daily - Generated at the end of each day covering 24 hours of data
Weekly - Generated at the end of each week, covering 7 days of data
Monthly - Generated at the end of each month, covering 1 month of data.
Annual - Generated at the end of each year, covering 1 year of data.
Custom - Generated at specified time daily covering specific number of hours.

Manual Report
As mentioned above the defined reports are empty skeletons without any data inside. There are two ways to have them be filled with data –
- By issuing a 'RUN MANUALLY' command
- By scheduling the report to be created and sent in a certain rate
For generating a report manually the user needs to:
- Select the report from the list of reports
- Define the time range he would like the report to cover
- Run the 'RUN MANUALLY' command.

Step 6 - Delivery
The automatically generated reports can be delivered to a list of Email recipients, or alternatively stored at a specified location.


